Which Vehicles Are Most Dangerous to Cyclists? Now You Can Know.
Your city wants to make streets safer for cyclists. You know that SUVs and trucks cause more severe injuries than regular cars. But your traffic cameras can't tell them apart. You're left guessing which vehicle types are the real problem on your roads.
You're stuck with generic data. You can't enforce "3-foot passing" laws effectively. You can't prove which neighborhoods need protected bike lanes most. And insurance companies can't calculate accurate risk because they don't know what's really on the street.
What Researchers Discovered
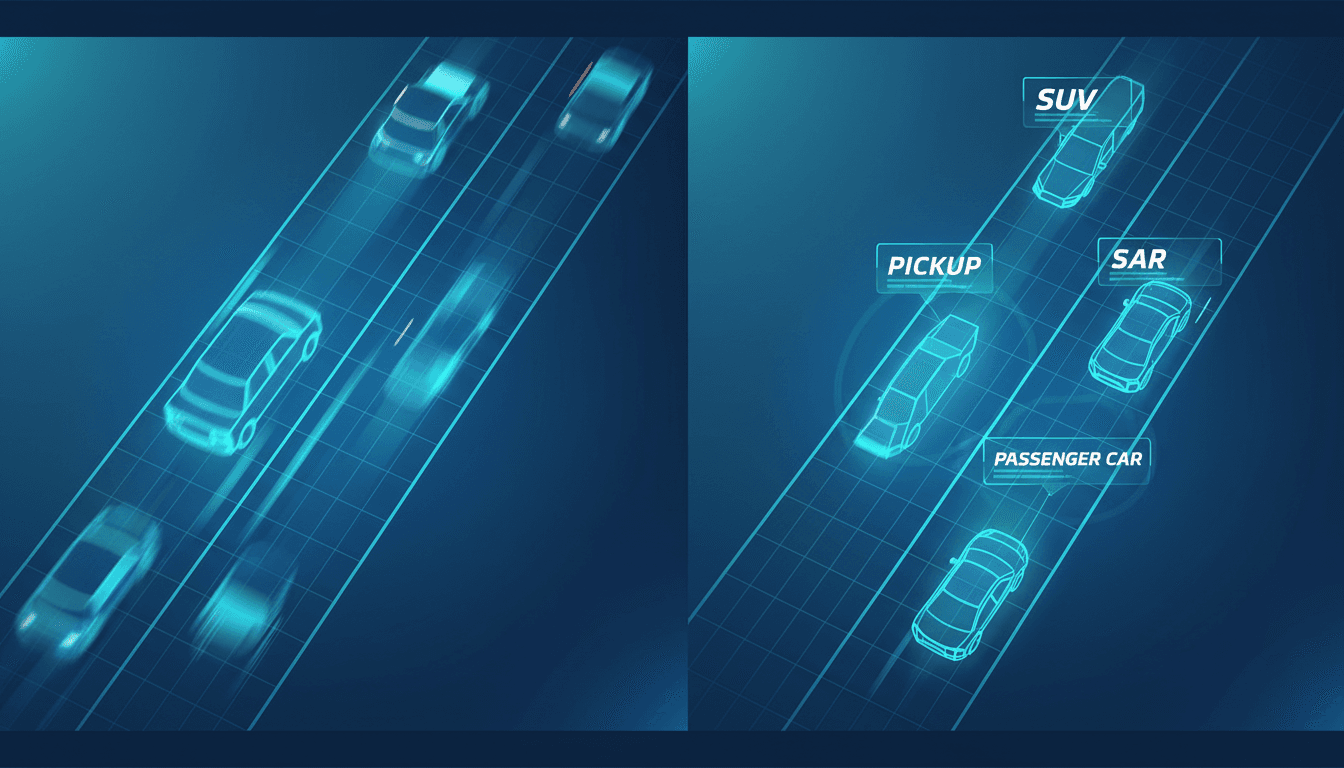
Researchers built an AI system that solves this exact problem. It automatically identifies six specific vehicle types from regular traffic camera footage: passenger cars, SUVs, pickup trucks, minivans, large vans, and commercial trucks. It achieves 94% accuracy at its home location and 89% at new, unseen locations.
Think of it like upgrading a security camera that can only tell "person" from "animal" to one that can specifically identify "dog," "cat," "deer," and "raccoon." This level of detail lets you measure exactly which vehicles are passing cyclists too closely.
The system includes a critical feature: a confidence check. When it's uncertain about a classification, it flags the prediction as "unknown" instead of guessing wrong. This prevents misleading data from ruining your analysis. It's like a quality inspector who says "I'm not sure about this one" instead of making a bad call.
Best of all, the researchers made everything freely available—code, training data, and trained models. You can implement this immediately without licensing fees. The full details are in their paper: An Open-Source Two-Stage Computer Vision Pipeline for Fine-Grained Vehicle Classification using Vision Transformers.
How to Apply This Today
You don't need to wait. You can start using this system right now. Here are three concrete steps to implement it this week.
Step 1: Set Up Your Testing Environment
First, get the code running on a sample video. The researchers provide everything on GitHub.
- Clone the repository. You'll find installation instructions and dependencies listed. The system requires Python and common machine learning libraries like PyTorch.
- Run it on a test video. Use 30-60 seconds of traffic footage from one of your existing cameras. The system will process the video and output a CSV file listing each detected vehicle and its predicted type.
- Check the confidence scores. Review the "unknown" flags. For your initial test, focus on predictions with high confidence (above 90%). This validates that the system works with your footage.
For example: The transportation department in Austin, Texas, could take one hour of footage from a known cyclist conflict zone. They'd run the AI and immediately see a breakdown: "45 passenger cars, 28 SUVs, 12 pickup trucks, 3 minivans."
Step 2: Integrate with Your Camera Network
Once testing is successful, plan a pilot deployment.
- Select 3-5 high-priority camera locations. Choose intersections or road segments with high cyclist volume and a history of near-misses.
- Set up batch processing. The system currently works on recorded video, not live streams. Configure it to automatically process footage from your selected cameras every night.
- Automate data collection. Write a simple script to collect the daily CSV outputs into a central database or dashboard. This creates a continuous stream of vehicle composition data.
Estimated effort: A two-person team (one with basic Python skills) can complete steps 1 and 2 in 3-5 business days.
Step 3: Turn Data into Action
Now use the specific vehicle data to make decisions.
- Enforce passing distance laws. Correlate vehicle type data with cyclist passing events. If data shows SUVs are 40% more likely to pass within 2 feet of a cyclist than passenger cars, you can target enforcement accordingly.
- Prioritize infrastructure. Identify routes with high volumes of trucks and SUVs. These are your top candidates for protected bike lane installation.
- Refine risk models. Share anonymized vehicle composition data with insurance partners. A neighborhood with 60% SUVs/trucks presents a different risk profile than one with 80% passenger cars.
What to Watch Out For
This tool is powerful, but be aware of its limits.
- Minivan performance drops at new locations. When moved to an unseen camera, accuracy for minivans dropped from 91% to 72% in the study. For now, consider grouping minivans with "passenger cars" in your analysis if your pilot shows similar results.
- It's not real-time (yet). The system processes recorded video. You can't use it for instant traffic alerts or live law enforcement. It's for analysis and planning.
- Weather and lighting matter. The system was tested in clear daytime conditions. Performance in heavy rain, snow, or at night is unproven. Start with footage from optimal conditions.
Your Next Move
Start by running one test. This week, take 60 seconds of traffic footage from any camera. Download the free code and see what the AI identifies.
The goal isn't perfection. It's actionable insight. Knowing that "SUVs make up 35% of traffic but 60% of close passes" changes everything. It turns guesswork into a measurable problem you can solve.
What's the first question about vehicle risk in your city that this data could answer?
Comments
Loading...